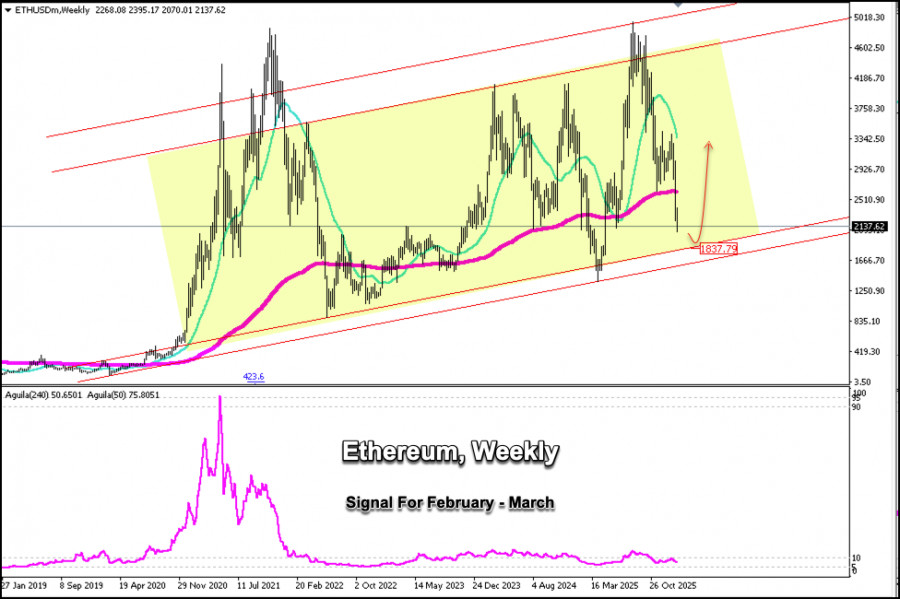
Ethereum is trading around $2,137, returning to price levels of March 2025. Since its peak around the psychological level of $5,000, Ethereum has lost more than 50% of its value, and it is likely that the bearish cycle will continue, and ETH could reach the lower band of the downtrend channel formed since April 2020, around $1,837.
If Ethereum rebounds above the psychological level of $2,000, it could be seen as an opportunity to open long positions with targets towards the weekly 200 EMA located at $2,650.
The weekly chart shows bearish potential for Ethereum, although technically oversold levels are already being observed. A technical rebound is likely to occur around $2,000 or $1,837 in the coming weeks.
A weekly break below $1,800 could accelerate its bearish cycle, and Ether could reach $1,500, its 2025 low, and we could even expect a sharp drop towards 2022 price levels, around $1,100.
Given that Ethereum is trading within an uptrend channel and is approaching key support levels, we will look for opportunities to open long positions above the psychological level of $2,000 or, in extreme cases, above $1,800.