Společnost NVIDIA Corporation (NASDAQ:NVDA) oznámila účetní ztrátu ve výši 5,5 miliardy dolarů kvůli novým americkým exportním omezením na své H20 AI čipy určené pro Čínu, což vyvolalo ostré reakce na Wall Street. Analytici poukazují na zhoršující se geopolitická rizika pro firmu na jednom z jejích největších trhů.
Analytici z Wedbush uvedli, že tato ztráta, oznámená ve formuláři 8-K, je „jasnou výstrahou“ od administrativy prezidenta Trumpa, která zostřuje omezování čínského přístupu k pokročilým americkým čipům.
I když je finanční dopad zvládnutelný, Wedbush zdůraznil vážnější problém: čím dál větší potíže Nvidie na čínském trhu. Omezení označili za „masivní blokády“ v rámci eskalující technologické války mezi USA a Čínou.
„Hra s vysokými sázkami je napjatější kvůli lednové panice okolo DeepSeek… Nvidia je podle nás pro Trumpa jedním z herních žetonů,“ napsali analytici Wedbush.
Mizuho odhadl, že Nvidia měla objednávky na H20 v hodnotě přibližně 16 miliard dolarů, z nichž mohlo být dodáno asi 10 miliard. Částka 5,5 miliardy tak pravděpodobně odráží zásoby, které nelze kvůli zákazu exportu prodat.
Mizuho připomněl, že omezení odpovídají dřívějším očekáváním a jako klíčový faktor do budoucna označil kapitálové výdaje na AI v roce 2026.
Obě firmy zachovaly pozitivní pohled na akcie Nvidie, Mizuho potvrdil hodnocení „Outperform“ a cílovou cenu 168 dolarů. Wedbush však varoval před zvýšenou volatilitou v důsledku pokračujících obchodních střetů mezi USA a Čínou.
The EUR/USD currency pair resumed its upward movement on Wednesday. There was no significant macroeconomic background from either the Eurozone or the U.S. yesterday, apart from an insignificant retail sales report from Europe, which didn't provide any notable reaction. At first glance, this new upward movement might seem surprising. However, it's not surprising at all when considering last Friday's news as well as developments in the first half of this week.
To recap: last Friday, critical labor market data from the U.S. was released—and it completely collapsed, exposing major weaknesses in the American economy resulting from Donald Trump's policies. This was followed by the dismissal of the head of the Bureau of Statistics, then the resignation of Adriana Kugler, and then another disappointment came from the U.S. ISM Services PMI. Meanwhile, Trump continued slapping tariffs on every country he could remember. Yesterday, India was "rewarded" with 25% tariffs for buying oil from Russia. Therefore, the subsequent drop in the dollar is not surprising. We expect that the 2025 uptrend will continue.
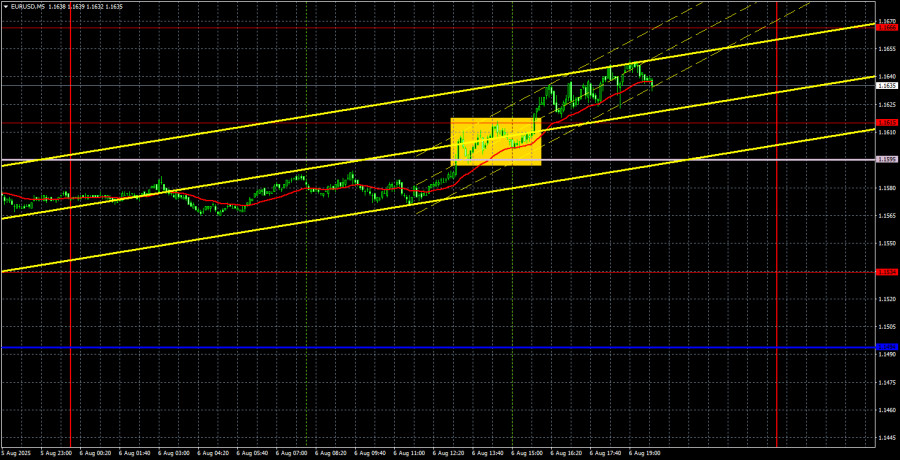
On the 5-minute chart, one buy signal was formed yesterday, but the movement began from the 1.1534 level, around which the signal had already formed on Tuesday. Therefore, buying was possible as early as Tuesday. We believe that even if the dollar doesn't collapse like a stone, it will still depreciate in one way or another. Volatility this week is low, and the macroeconomic background is virtually nonexistent.
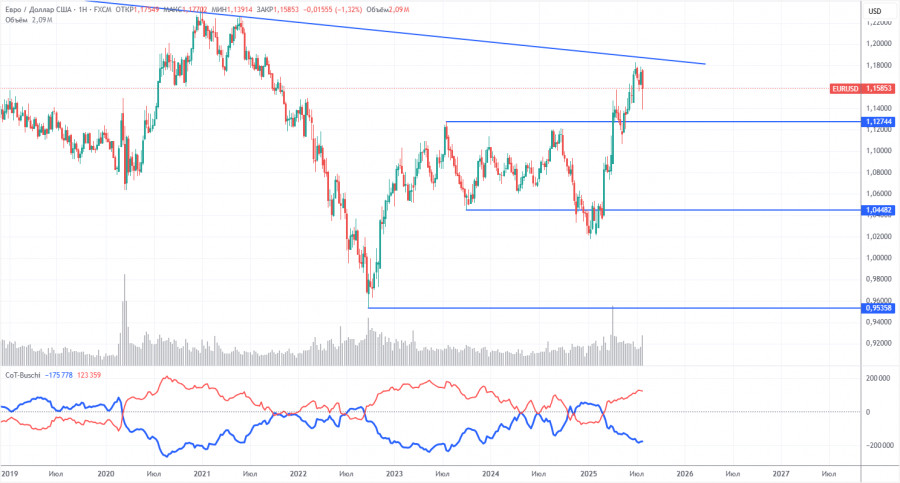
The latest COT report is dated July 29. In the illustration above, it is visible that the net position of non-commercial traders had long been "bullish"; the bears barely took the upper hand at the end of 2024 but quickly lost it again. Since Trump assumed the presidency, the dollar has been the only currency to fall. We cannot say with 100% certainty that the U.S. dollar will continue to decline, but current global developments suggest that scenario.
We still do not see any fundamental factors supporting the euro's strength. However, there remains one very significant factor pushing the U.S. dollar down. The global downtrend persists — but what does it matter where the price has been moving over the past 16 years? Once Trump ends his trade wars, the dollar might start rising, but the latest trade deals have shown that the conflict will continue in one form or another.
The red and blue lines of the indicator continue to show a bullish trend. During the last reporting week, long positions among the "non-commercial" group increased by 400, while short positions rose by 2,600. Consequently, the net position decreased by 2,200 contracts, which represents a minor change.
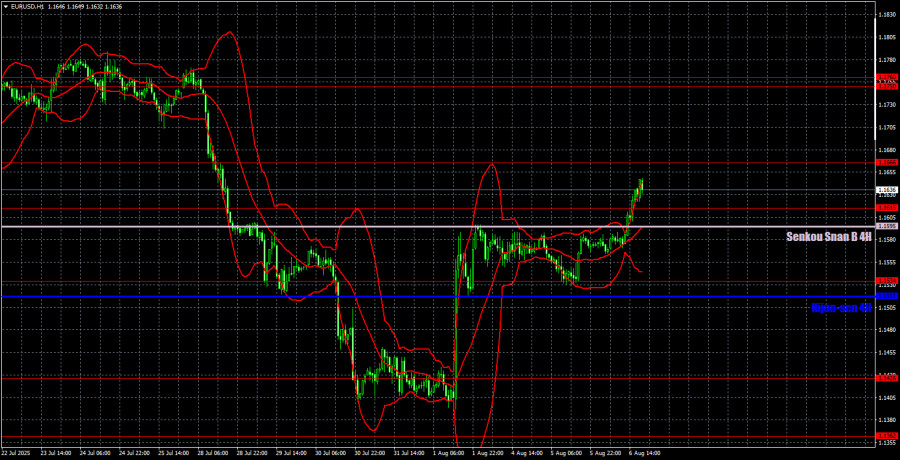
On the hourly timeframe, EUR/USD sharply started rising—this could be the beginning of a new uptrend. On this chart, the price broke through the Senkou Span B line, and on the daily timeframe, it bounced off the same line. Therefore, there are now more reasons to expect further upward movement than to anticipate another decline in the euro.
For August 7, we highlight the following levels for trading - 1.1092, 1.1147, 1.1185, 1.1234, 1.1274, 1.1362, 1.1426, 1.1534, 1.1615, 1.1666, 1.1750-1.1760, 1.1846-1.1857, as well as the Senkou Span B (1.1595) and Kijun-sen (1.1517) lines. The Ichimoku indicator lines may shift during the day, which should be considered when identifying trade signals. Don't forget to set a Stop Loss at breakeven once the price moves 15 pips in the right direction—this will protect against potential losses if the signal turns out to be false.
On Thursday, the European Union is scheduled to publish German industrial production and the US is scheduled to publish jobless claims. Both reports are minor. Volatility may be low again.
On Thursday, the upward movement may continue, at least based on the bounce from the Senkou Span B line (daily timeframe) and the double bounce from the 1.1534 level. The key Senkou Span B line was also broken on the hourly timeframe. Therefore, we continue holding long positions with targets at 1.1666 and 1.1750–1.1760. We are not considering selling for now.