Gold confidently enters 2026 as one of the strongest assets. In just the first few weeks of January, the price rose by about 11%, and in the middle of the week, a historic high was recorded—just below $4,900 per ounce. Such a strong start to the year speaks volumes about the extremely high demand, but more importantly, it raises the question of why this demand is sustained and is expected to increase.
Against this backdrop, the gold forecast has been revised upward: the target price for the end of the year has been increased from $4,900 to $5,400 per ounce, which represents an expectation increase of 17%. The $5,000 level is now viewed not as an extreme scenario but as a logical target within the current trend.
The current rise cannot be attributed to a single factor. Gold is receiving support from multiple directions, and it is their combination that makes the movement robust.
Firstly, the demand for so-called "safe havens" has surged sharply. The geopolitical backdrop remains tense: relations between the U.S. and Iran are worsening, and tariff disputes between the U.S. and the EU are back in the spotlight. For the market, this means increased uncertainty, and gold traditionally benefits during such periods because it does not carry credit or political risks.
Secondly, there is growing concern about the state of the global financial system and the role of central banks. Fears about financial stability, debt burdens, and the independence of monetary policy are intensifying interest in assets that are not subject to regulatory decisions. In such an environment, gold ceases to be merely a "safe-haven asset" and becomes a long-term anchor of trust.
Thirdly, structural demand from the private sector and central banks of developing countries is becoming increasingly noticeable. These purchases are particularly important because they are less sensitive to short-term price fluctuations. This type of demand does not chase momentum and typically supports the market even during corrections, creating a higher price "floor."
It is this combination of geopolitical risks, systemic concerns, and institutional buying that explains why the rise in gold appears not to be a speculative spike but a conscious capital redistribution.
From a technical analysis perspective, gold remains in a stable uptrend. Momentum indicators such as MACD and ADX continue to indicate strength in the movement, and the balance of power between buyers and sellers remains tilted in favor of the bulls. Additional oscillators confirm that the upward momentum still dominates.
However, the market shows clear signs of overheating. RSI, CCI, and Stochastic RSI are in overbought territory, indicating stretched conditions. This does not mean a reversal but increases the likelihood of a short-term pause—either in the form of sideways consolidation or through a limited correction.
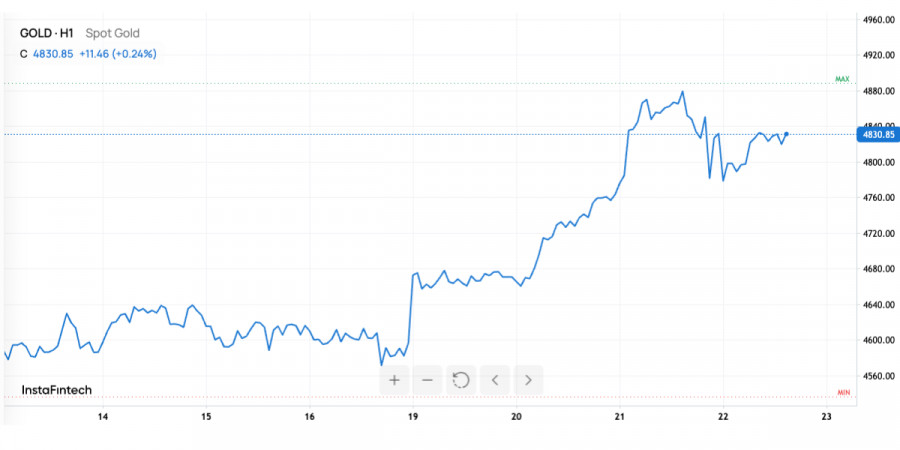
Intraday dynamics emphasize this picture. The session began with a noticeable upward gap, after which the price traded in a broad range of $4,761.27 – $4,879.69. High volatility indicates active profit-taking, but the price remaining closer to the middle of the range suggests more consolidation at high levels than a downward reversal.
Over the next five trading days, movement is expected within the range of $4,800–$4,970. This corridor reflects the current balance between strong bullish momentum and overheated indicators.
The base scenario assumes consolidation above $4,800. If this level is maintained, the market remains in a bullish phase, and attempts to move towards $4,870–$4,970 appear quite realistic. If buying pressure intensifies, the upper boundary of the range may be tested quite quickly.
However, if $4,800 is broken downward, this will signal a short-term correction with potential movement towards $4,760. Such a pullback will not disrupt the global trend but will allow the market to relieve overheating and redistribute positions.
It is important to note that the market structure remains healthy: higher lows are forming, moving averages are directed upward, and overall positioning indicates a soft bullish phase despite the volatility.
Gold at the beginning of 2026 is in a rare position where fundamental and technical factors are aligned. The rise is supported not only by fear and speculation but also by sustained institutional demand. Market overheating increases the risk of short-term pullbacks; however, as long as the price remains above $4,800, the upward trend remains a priority.
The psychological mark of $5,000 looks achievable within the year, and the $5,400 target is increasingly viewed as realistic if the current macroeconomic and geopolitical backdrop remains unchanged. In these conditions, gold continues to strengthen its status as a key safe-haven asset and a main beneficiary of global uncertainty.