The GBP/USD currency pair does not want to follow the EUR/USD pair this week, although that would be the most logical course of action. Recall that for most of the time, the euro and pound trade almost the same, and this week's fundamental background is 90% related to the U.S. dollar. Thus, it is the dollar that rises or falls, while other currencies are simply following it. But not the pound, and not this week.
What explains the behavior of the British troublemaker? In reality, there's no explanation. We remind traders once again that the market moves not only based on fundamentals or macroeconomics. If the logical chain "news – movement" worked, then any movement in the market could be predicted with 100% probability. The problem is that, in practice, things are much more complicated. The market comprises a large number of participants, not all of whom aim to profit from exchange rate differences. Thus, the British currency might be rising, but some major player might suddenly start selling the British pound, increasing supply. Therefore, let's remind ourselves again: do not try to explain every single movement in the market, or the absence of one.
In recent days and weeks, the British pound, first, has been trading within a limited range, and second, it constantly jumps up and down. This means the market is nervous and panicking. What is causing the panic? Once again, it's the same as before: Greenland, Trump's attacks on the Federal Reserve, another round of criticism and threats directed at Powell, threatening Latin American countries, an unclear deal with Mark Rutte, the introduction of new tariffs, and then the cancellation of new tariffs four days later. In essence, the GBP/USD pair has been stuck in the same place for several weeks now.
What could shift it from this position? In our opinion, it is certainly not the U.S. GDP report. The first two estimates showed quite a strong growth of the U.S. economy in the third quarter, which nobody in the markets believes anymore. Recall that the structure of the last estimate showed that GDP is growing due to increased government spending (for which, by the way, Trump criticized the European Union), as well as due to the collection of import tariffs (which the U.S. Supreme Court cannot seem to cancel).
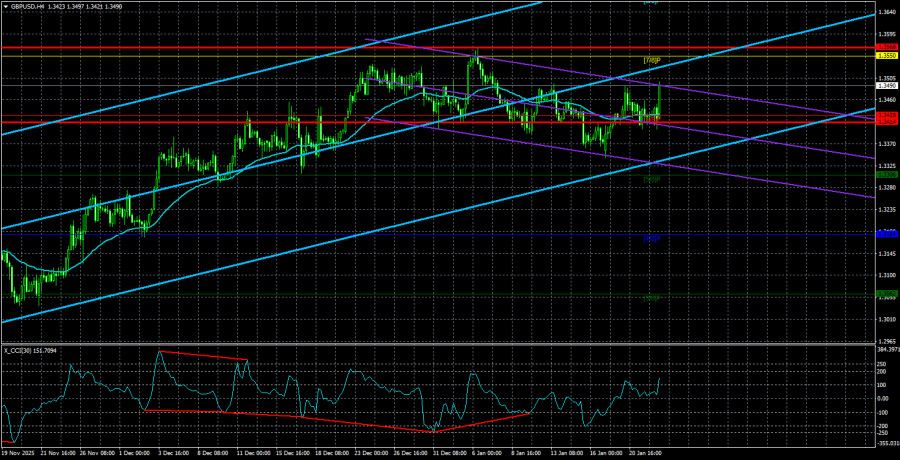
In our view, technical analysis is the only basis for making trading decisions right now. The technical indicators on the daily timeframe signal a likely renewal of the upward trend, and pauses in movement are absolutely normal. The technical indicators on the 4-hour timeframe indicate a complex correction, after which the trend is also expected to resume. The CCI indicator has grown tired of entering the oversold area and drawing "bullish" divergences. And let's remember that the euro has been in total flat for seven months (!!!). The British pound is dependent on the euro. The spiral continues to tighten, but someday it will "explode."
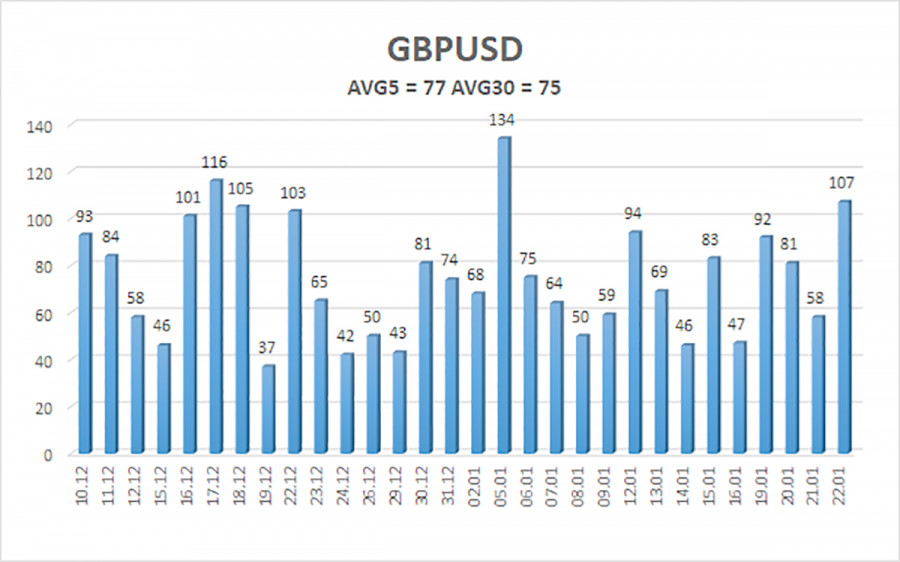
The average volatility of the GBP/USD pair over the last five trading days is 77 pips. For the pound/dollar pair, this value is "average." On Friday, January 23, we therefore expect movement within the range limited by the levels of 1.3414 and 1.3568. The upper linear regression channel is directed upward, indicating a trend recovery. The CCI indicator has entered the oversold area six times over the past months and has formed numerous "bullish" divergences, which have consistently warned traders of the continuation of the upward trend.
S1 – 1.3428
S2 – 1.3306
S3 – 1.3184
R1 – 1.3550
R2 – 1.3672
R3 – 1.3794
The GBP/USD currency pair is attempting to resume the upward trend of 2025, and its long-term prospects have not changed. Donald Trump's policy will continue to exert pressure on the U.S. economy, so we do not expect the American currency to grow. Thus, long positions with targets at 1.3550 and 1.3672 remain relevant in the near term as long as the price remains above the moving average. The price location below the moving average will allow for small shorts with a target of 1.3306 on technical grounds. From time to time, the American currency shows corrections (globally), but for a trend to strengthen, it needs global positive factors.