Systémové riziko má přednost před mezinárodními normami, země se vrací do éry nulových selhání.
Zatímco čínská ekonomika čelí složité kombinaci obchodních konfliktů, poklesu cen nemovitostí a utlumené spotřebitelské důvěry, na trhu s podnikovými dluhopisy se objevuje zvláštní jev: téměř žádné nové případy nesplácení. Podle údajů agentury S&P Ratings se v roce 2025 objevil zatím jen jeden případ takzvaného „prvního defaultu“, což je oproti 16 případům v roce 2024 výrazný pokles. Tento vývoj však neznamená všeobecné zlepšení finančního zdraví firem, ale spíše vládní intervenci, která systematicky brání výskytu nesplácení – především u státních podniků.
Namísto volného trhu, jaký se Čína snažila budovat v posledních desetiletích, převládá v současnosti snaha minimalizovat systémová rizika. Vláda tak upustila od dřívějšího trendu přibližování mezinárodním standardům a znovu prosazuje stabilitu prostřednictvím přímých zásahů.
Kam se situace vyvine v dalších týdnech a měsících? To v tuto chvíli zůstává otázkou.

Zatímco ještě v roce 2014 vláda vítala první default jako známku zralosti trhu, dnes činí opak. Dle Charlese Changa z agentury S&P se trh s dluhopisy vzdálil normálnímu fungování a vrátil se k modelu, v němž selhání firem – především těch státních – prakticky není možné. Státní podniky totiž podle oficiálních směrnic dostaly pokyn zajistit nulovou platební neschopnost, což ilustruje změnu v přístupu k řízení rizik.
Zatímco v minulosti došlo k určité liberalizaci a rostoucí toleranci k firemním bankrotům, pandemie a rostoucí geopolitická nejistota způsobily obrat. V důsledku toho dnes čínský dluhopisový trh opět připomíná spíše nástroj státní politiky než plně tržní prostředí.
Tento přístup má důsledky i pro zahraniční investory – jejich účast na trhu klesla podle odhadů Goldman Sachs na 0,29 %, což je nejméně za více než deset let. Důvěra v transparentnost, likviditu a výnosy tak zůstává nízká, navzdory zdánlivé stabilitě.
Absence platebních selhání však neznamená, že by čínské firmy neměly problémy. Naopak. Jak uvedl Chang, místo nesplácení dochází k restrukturalizaci dluhů a prodlužování splatností bankovních úvěrů. Část podniků rovněž vyrovnává své závazky pomocí obchodních směnek s opožděnými platbami – tedy skrytými formami platební neschopnosti, které nejsou zachyceny v oficiálních statistikách.
To znamená, že celkové riziko v systému zůstává, jen se přesouvá mimo sledovaný trh s dluhopisy. Zatímco agentura S&P dokáže kvantifikovat vývoj v oblasti podnikových obligací, na paralelním bankovním trhu nebo v oblasti krátkodobých směnek panuje výrazná netransparentnost.
Je zřejmé, že se vláda snaží zabránit eskalaci problémů tím, že přesouvá zátěž do méně viditelných struktur systému. Tím však zároveň podkopává důvěru v oficiální statistiky, protože ty poskytují pouze částečný obraz skutečného stavu podnikových financí.
Trh s podnikovými dluhopisy je dnes v Číně převážně tvořen státními emitenty, což podle agentury Fitch Ratings i dalších analytiků vede ke zlepšení průměrné úvěrové kvality. Jenže zároveň vytlačuje soukromé firmy a snižuje tržní diverzitu. Pokud by se čínská vláda rozhodla snížit svou podporu, mohl by se počet nesplácení opět dramaticky zvýšit.
Z historického hlediska platí, že ve chvílích ekonomické nejistoty roste míra implicitní podpory, což nyní zjevně platí více než kdy jindy. Navzdory tomu však i státní podniky nejsou zcela imunní – v posledních letech se i u nich vyskytly případy selhání, byť ojedinělé.
Vedle toho pokračují problémy v oblasti realitního sektoru. Podle údajů S&P dosáhla míra nesplácení v roce 2022 u offshore dluhopisů developerů téměř 28 %, zatímco onshore trh vykázal 10 %. Letos zatím nesplácely své závazky například společnosti Guangzhou R&F a China Grand Automotive, i když čínská metodika je v klasifikaci defaultů mnohem mírnější než ta mezinárodní.

Nejde tedy o to, že by se krize vyřešila – spíše byla zamaskována administrativními zásahy a redefinicí selhání. Výsledkem je pokřivený trh, který sice nevykazuje výkyvy, ale také neposkytuje reálný obraz o zdraví podnikové sféry.
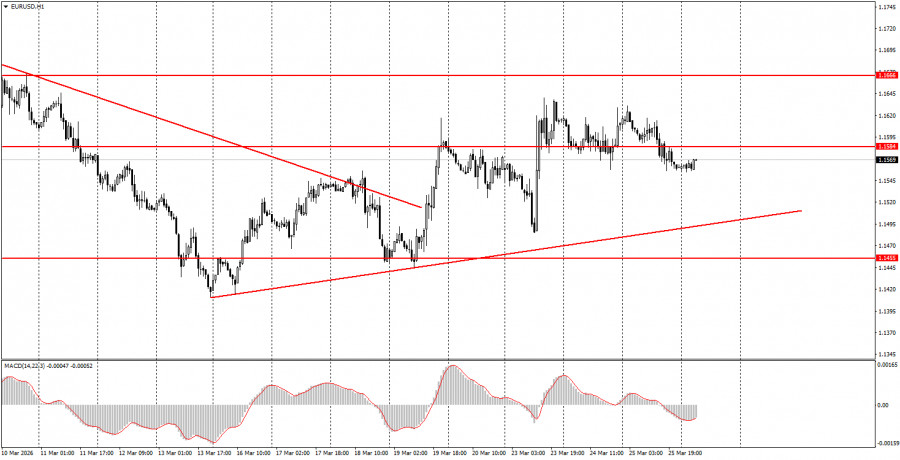
The EUR/USD currency pair showed no notable movements on Wednesday. There was a lack of macroeconomic background during the day; Christine Lagarde's speech did not provide any insights for traders, and there was no encouraging or escalating news from the Middle East. All we learned throughout the day was Iran's rejection of any negotiations with the US, as well as the US's preparations (despite earlier statements from Trump) for a ground operation in Iran. Therefore, at this point, it can be confidently stated that there is no talk of de-escalation in the Middle East in the near term. If Trump initiates a ground operation in Iran, it could further exacerbate the current situation in energy markets. Inflation may rise further globally, and the dollar could rise again as a safe-haven asset. Thus, a ground operation at this time could trigger a new decline in the EUR/USD pair. Technically, the upward trend on the hourly timeframe remains intact.
On the hourly timeframe, the downward trend is completed, but we may be dealing with yet another ordinary upward correction. In early 2026, a long-term upward trend resumed, so we still expect medium-term growth for the euro. The fundamental background remains very challenging for the American currency; however, geopolitics is currently the main focus for the market. It is precisely this that prevents the dollar from falling.
On Thursday, novice traders may consider short positions in the event of a bounce from the 1.1584-1.1591 area, with a target of 1.1527-1.1531. If the price consolidates above the 1.1584-1.1591 area, long positions can be opened with a target of 1.1655-1.1666.
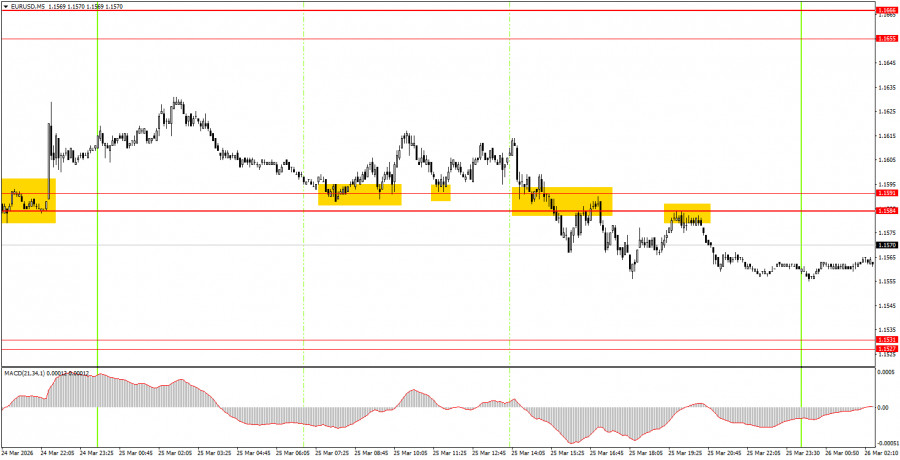
On the 5-minute timeframe, one should consider the levels 1.1267-1.1292, 1.1354-1.1363, 1.1413, 1.1455-1.1474, 1.1527-1.1531, 1.1584-1.1591, 1.1655-1.1666, 1.1745-1.1754, 1.1830-1.1837, 1.1899-1.1908. On Thursday, there are no significant events to note. The consumer confidence index will be published in Germany, while the US will see jobless claims released.
Price levels of support and resistance are levels that serve as targets when opening buys or sells. Take Profit levels can be placed around them.
Red lines represent channels or trend lines that show the current trend and indicate the direction in which it is preferable to trade now.
The MACD indicator (14,22,3) – the histogram and the signal line – is a supporting indicator that can also be used as a source of signals.
Important speeches and reports (always included in the news calendar) can significantly affect the movement of the currency pair. Therefore, during their release, trading should be done with utmost caution, or traders should exit the market to avoid sharp price reversals against the previous movement.
Beginning traders in the forex market should remember that not every trade can be profitable. Developing a clear strategy and effective money management are the keys to long-term trading success.