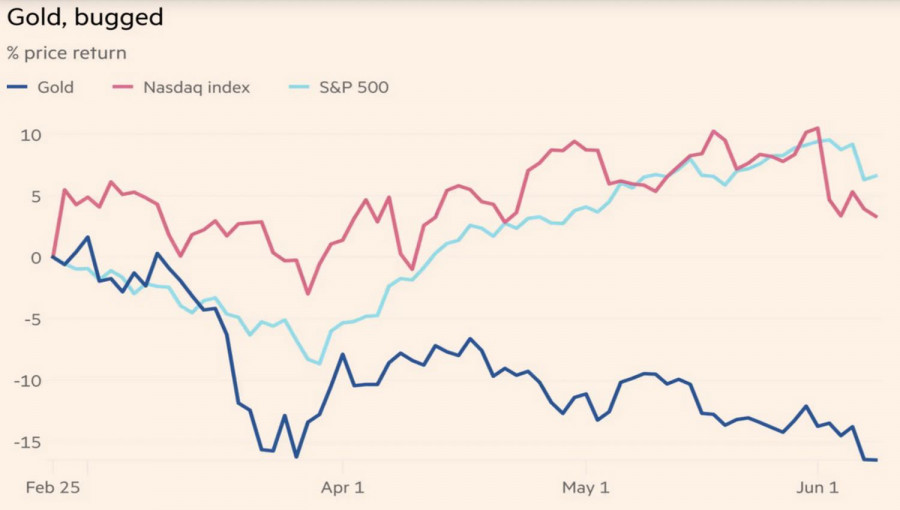
Gold is breaking all the previously known patterns of market analysis. It falls when stock indices rise. When the S&P 500 drops, XAU/USD heads up in parallel. For decades, it was believed that the precious metal loved fear, and in turn, fear loved the precious metal. But the conflict in the Middle East has shown that this is far from the case.
Gold and US stock indices: recent dynamics
Gold is a safe?haven asset, but over the past several years, it has behaved like a risk asset. Massive Fed monetary stimulus pushed XAU/USD to records in 2011 and 2020, and a federal funds rate cut at the end of 2025 helped the metal soar to new all?time highs. It came to be seen as a highly liquid portfolio instrument that could help meet margin requirements during equity sell-offs.
As a result, a positive correlation between gold and equity indices developed, which was broken by events in the Middle East. While the S&P 500 managed to gain about one?fifth of its value from the March low, the precious metal kept falling. Of course, it lacks the powerful drivers of blockbuster corporate earnings and the AI technology frenzy. Still, XAU/USD hasn't looked this bleak in a long time.
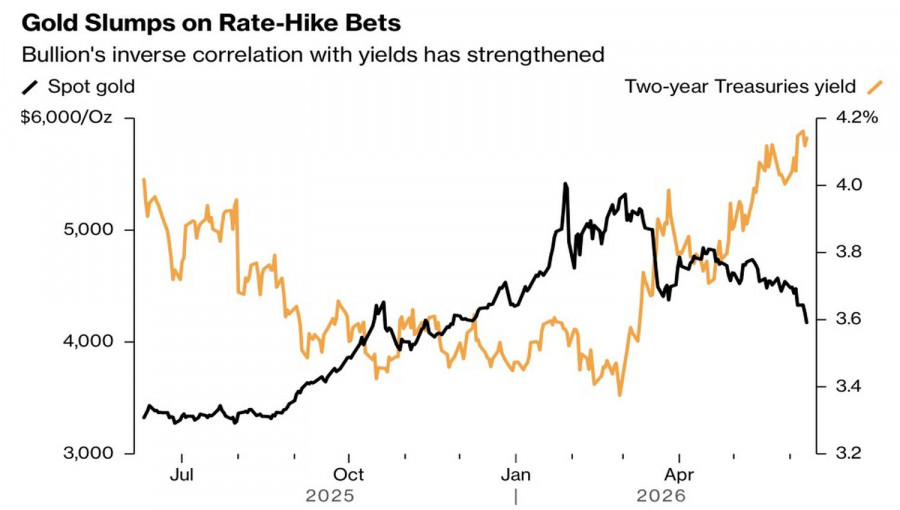
The decline is being aided by an unfavorable external environment. Gold pays no interest, so its price typically falls during rallies in Treasury yields. The metal is quoted in US dollars, so a rally in the USD is plainly punitive for it.
Gold and US Treasury yield dynamics
If in 2022–2023 gold was supported by central bank buying and ETF inflows, none of that is present now. Regulators made only modest purchases of bars in April after net sales in March. According to research by Standard Chartered Bank, around 270 tonnes of holdings of specialist exchange-traded funds were underwater in early June. The fall in XAU/USD pushed that figure to 298 tonnes. Capital outflows from ETFs will exacerbate selling in the spot and futures markets.
The unfavorable external backdrop and lack of demand support from bullion purchases and specialist ETFs are only part of the problem. Gold has broken long-standing relationships because of a burst bubble. At the start of 2026 it rose too quickly and began to resemble Bitcoin in its heyday. Both assets were bought simply because of their straight-line rallies — rallies that had no fundamental justification. In the end it finished as it had to: a collapse.
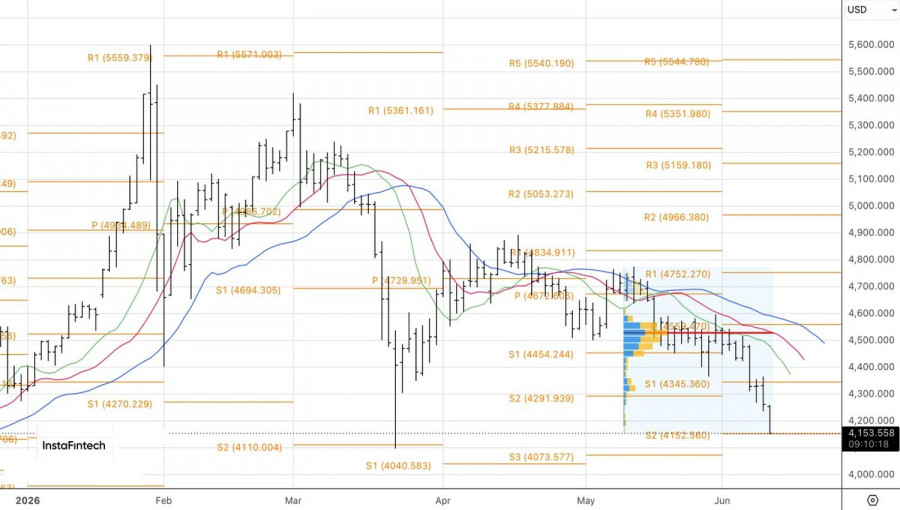
Technically, on the daily gold chart, the bears are preparing to resume the downtrend. A decisive break of support at the pivot level of $4,150 per ounce will be a necessary condition. That would allow adding to short positions initiated around $4,415 and $4,380.