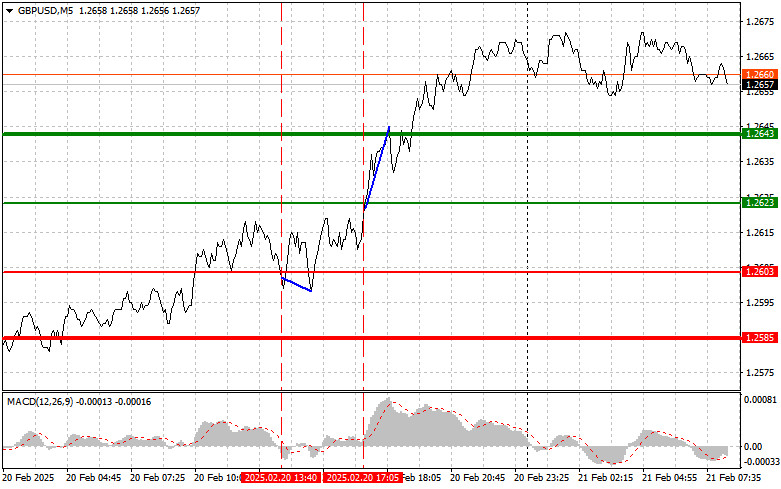
The price test at 1.2603 occurred when the MACD indicator had just started moving downward from the zero mark, confirming the correct entry point for selling the pound. However, the chart shows that the pair did not experience an active decline. Closer to the middle of the U.S. session, a test of 1.2623 took place when the MACD had just started moving upward from the zero mark, confirming the correct entry point for buying the pound. As a result, the pair rose to 1.2643.
The pound has rebounded, benefiting from increased optimism among risk asset buyers who are anticipating a quick resolution to the Russia-Ukraine conflict. This optimism has eased the pressure on the British currency, which had previously been weighed down by recession fears in the UK, exacerbated by the energy crisis and high inflation. Additionally, the pound has found support from a weakening U.S. dollar, driven by a reassessment of expectations regarding the Federal Reserve's future policy.
Today, data on the UK's manufacturing PMI, services PMI, and composite PMI will be released. Ahead of these reports, the British pound is showing some stability, as investors hope the business activity indicators will confirm the relative resilience of the UK economy. Positive surprises in the data could lead to further growth of GBP/USD, potentially breaking through key resistance levels. However, weak data could trigger a wave of selling of the pound, especially if it coincides with further strengthening of the U.S. dollar due to expectations of a moderate Fed policy.
It is important to note that, aside from PMI data, GBP/USD dynamics will also be influenced by other factors, such as geopolitical developments and overall market sentiment. Therefore, when making trading decisions, it is necessary to consider all available information comprehensively.
Regarding the intraday strategy, I will rely more on executing Scenarios #1 and #2.
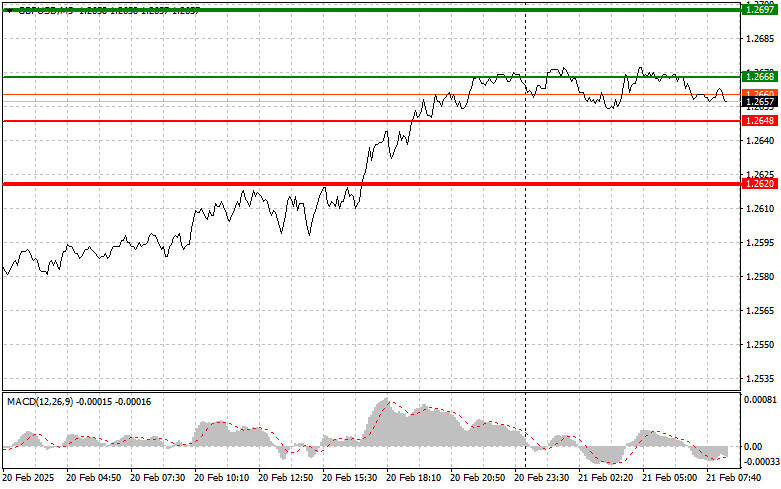
Scenario #1: I plan to buy the pound today when the entry point reaches around 1.2668 (green line on the chart), aiming for a rise to 1.2697 (thicker green line on the chart). Around 1.2697, I plan to exit my buy positions and open sell trades in the opposite direction, targeting a 30-35 pip pullback. The pound's growth will depend on strong economic data. Important! Before buying, ensure that the MACD indicator is above the zero mark and beginning to rise.
Scenario #2: I also plan to buy the pound today if the price of 1.2648 is tested twice consecutively while the MACD indicator is in the oversold zone. This will limit the pair's downside potential and lead to an upward market reversal. A rise to the opposite levels of 1.2668 and 1.2697 can be expected.
Scenario #1: I plan to sell the pound today after an update of the 1.2648 level (red line on the chart), which will lead to a sharp decline in the pair. The key target for sellers will be 1.2620, where I plan to exit my sell positions and immediately open buy trades in the opposite direction, targeting a 20-25 pip pullback. Selling the pound is best done at the highest possible levels. Important! Before selling, ensure that the MACD indicator is below the zero mark and beginning to decline.
Scenario #2: I also plan to sell the pound today if the price of 1.2668 is tested twice consecutively while the MACD indicator is in the overbought zone. This will limit the pair's upside potential and lead to a market reversal downward. A decline to the opposite levels of 1.2648 and 1.2620 can be expected.