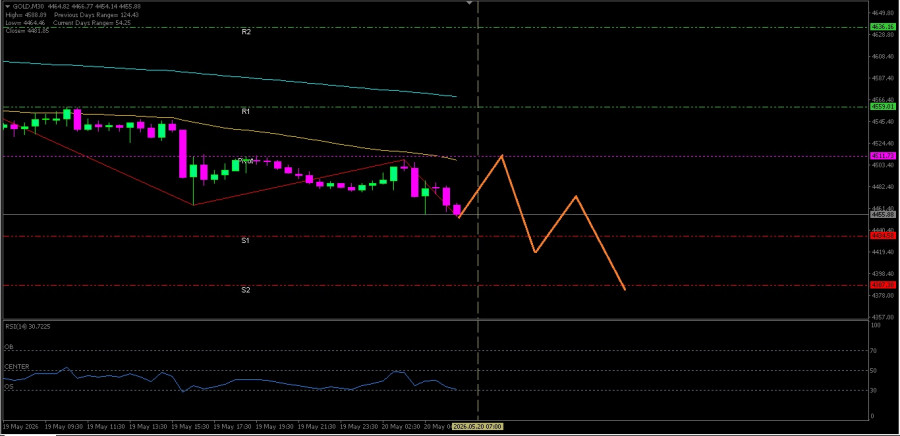
GOLD
With both EMAs condition forming a Death Cross intersection and RSI(14) indicator in the Neutral-Bearish level, confirmed that seller pressure is quite dominant, so it will bring Gold to move toward its nearest support level in the near term.
Key Levels
1. Resistance. 2 : 4636.16
2. Resistance. 1 : 4559.01
3. Pivot : 4511.73
4. Support. 1 : 4434.58
5. Support. 2 : 4387.30
Tactical Scenario
Pressure Zone: If 4434.58 is broken down, there is potential for continued weakness toward 4387.30.
Momentum Extension Bias: If 4387.30 is broken to the downside, Gold could test the support level at 4310.15.
Invalidation Level / Bias Revision
The downside bias is restrained if the price strengthens and breaks above 4636.16.
Technical Summary
EMA(50) : 4510.21
EMA(200): 4570.34
RSI(14) : 33.63
Economic News Release Agenda:
Today the United States will release the following economic data:
US - Crude Oil Inventories - 21:30 WIB
US - FOMC Meeting Minutes - 01:00 WIB