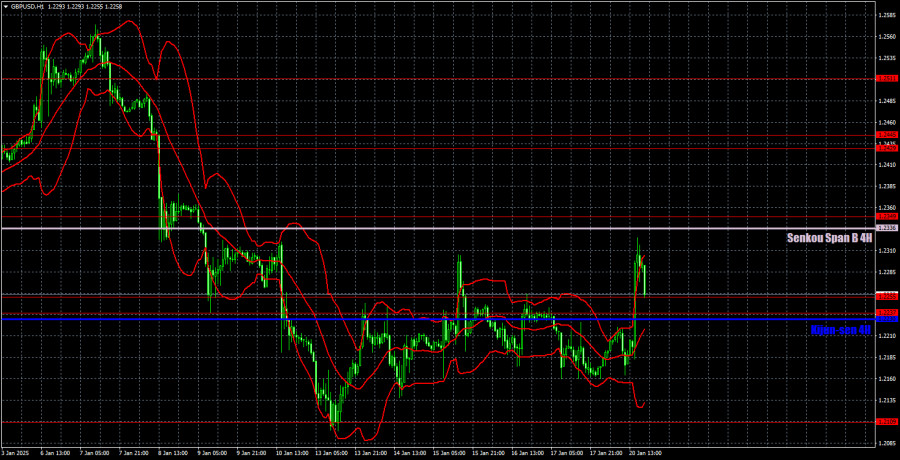
On Monday, the GBP/USD currency pair experienced a significant rise. The factors influencing this movement are similar to those discussed in the EUR/USD article. Surprisingly, there were no specific reasons for the dollar's decline throughout the day. Additionally, in the case of the British pound, it's not accurate to suggest that the market was simply taking profits from open short positions. Overall, we advise against participating in such movements, which often occur during Federal Reserve, European Central Bank, or Bank of England meetings. In these instances, the market tends to trade on emotions, making the movements illogical and rendering technical analysis unreliable. In short, these shifts are nearly impossible to predict.
What lies ahead for the British pound is a complex question. We still believe that a decline will continue in the medium term. Currently, the pound has yet to surpass the Senkou Span B line, which means that the downward trend remains intact on the 4-hour timeframe. We wouldn't be surprised if the pair returns to its previous levels by the end of today—levels similar to those seen before Monday. It's important to note that all reports from the UK last week were disappointing, yet the pound barely fell. Global factors, such as the monetary policies of the Fed and the BoE, continue to support the dollar.
In the 5-minute timeframe, a very good signal emerged yesterday. During the European trading session, the price bounced off a critical line and dropped by about 35 pips. However, it did not reach the nearest target, likely resulting in the trade closing with a Stop Loss at breakeven. Another buy signal formed in the 1.2237–1.2255 range, but there was no opportunity to act on it, as the price moved up too quickly and without any fundamental backing.

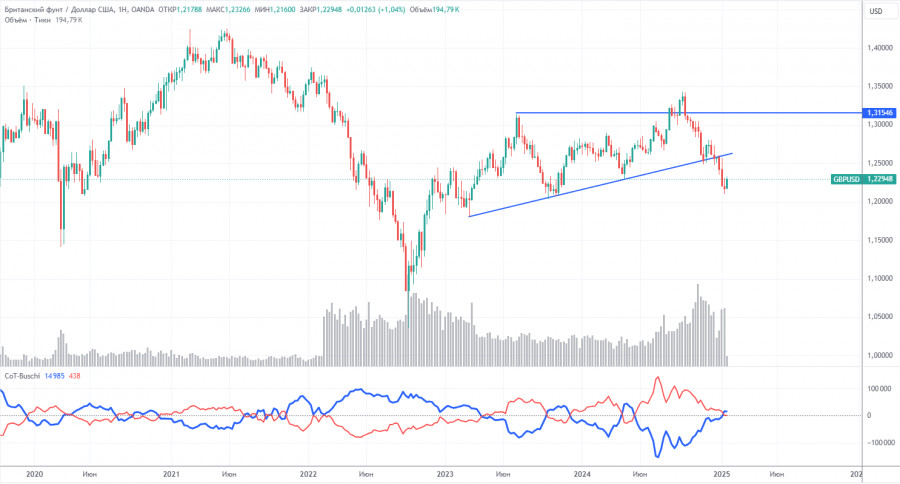
COT reports on the British pound show that the sentiment among commercial traders has been constantly changing in recent years. The red and blue lines in the reports, representing the net positions of commercial and non-commercial traders, frequently intersect and are typically close to the zero mark. Currently, these lines are near each other, suggesting there are approximately equal numbers of long and short positions.
On the weekly timeframe, the price initially broke through the 1.3154 level and then dropped to the trend line, which it successfully breached. Breaking this trend line suggests a high probability of the pound's continued decline. This concerns the long-term perspective.
According to the latest COT report, the "Non-commercial" group closed 700 buy contracts and opened 13,300 sell contracts. As a result, the net position of non-commercial traders decreased by 12,600 contracts over the week, which is negative for the pound.
The fundamental outlook still does not provide any support for long-term purchases of the pound sterling. The currency has a strong likelihood of resuming its global downward trend. Thus, the net position may continue to decline, indicating a reduced demand for the pound sterling.

On the hourly timeframe, the GBP/USD pair exhibits an overall bearish sentiment, with the potential for a new round of corrective movement to end just as quickly as previous ones. Currently, we don't see any reasons for the British pound to show growth, except for the technical necessity of occasional corrections. This pattern appears consistent each week—weak corrections followed by significant declines. In the medium term, we continue to anticipate a move toward $1.1800.
For January 21, we highlight the following key levels: 1.2052, 1.2109, 1.2237-1.2255, 1.2349, 1.2429-1.2445, 1.2511, 1.2605-1.2620, 1.2691-1.2701, 1.2796-1.2816. The Senkou Span B line (1.2336) and the Kijun-sen line (1.2230) may also provide potential trading signals. It is advisable to set a Stop Loss at breakeven once the price moves 20 pips in your favor. Keep in mind that the Ichimoku indicator lines may shift throughout the day, which should be taken into account when determining trading signals.
On Tuesday, there are no macroeconomic reports scheduled in the UK. In the US, the Producer Price Index will be released, which could impact overall market sentiment. Today, trading will rely primarily on technical analysis.